



Table of Contents
Most retail traders lose money not because they lack discipline but because they don’t understand how the market is designed to move.
The ICT Power of Three trading strategy changes that. It’s one of the most powerful frameworks in Inner Circle Trader (ICT) methodology, and once you grasp it, you start seeing markets in a completely different way.
In this guide, you’ll learn exactly what the Power of Three (PO3) is, how to identify its three phases on any chart, and how professional traders use it to time entries with precision.
No fluff. Just the strategy, step by step.
What Is the ICT Power of Three Trading Strategy?
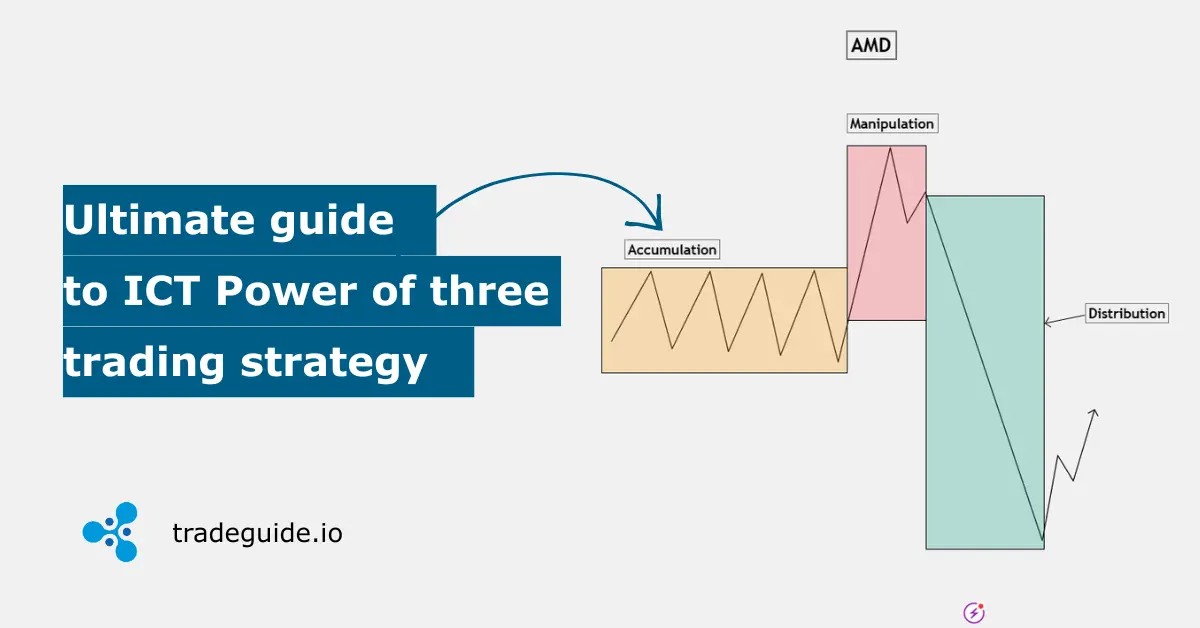
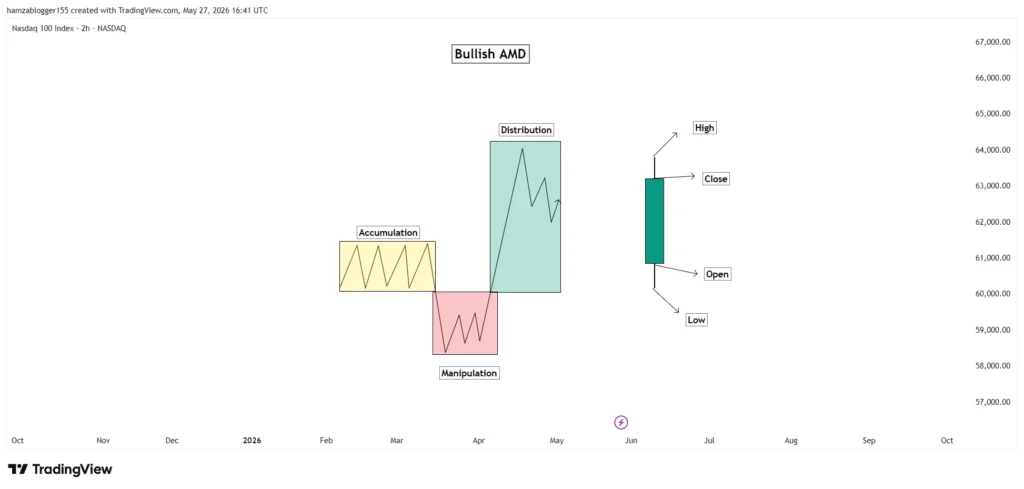
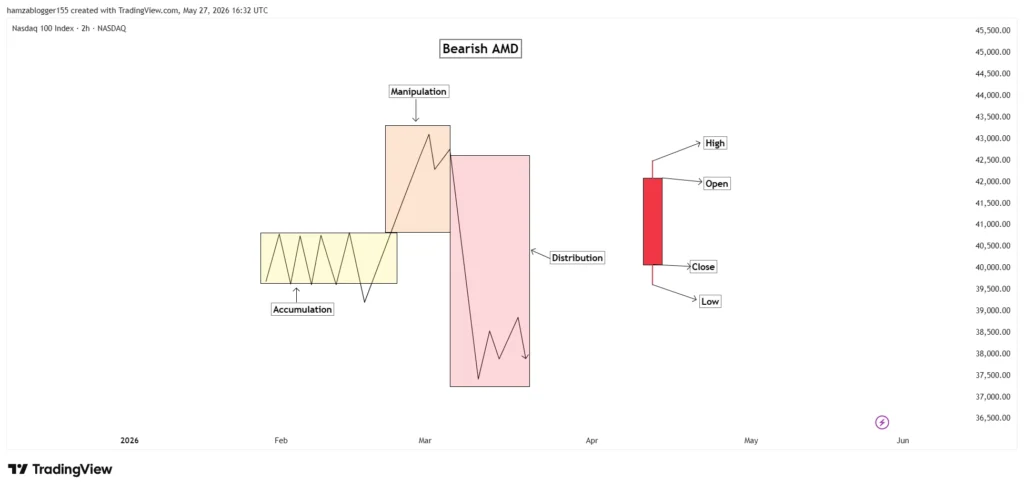
The ICT Power of Three is a three-phase price model—Accumulation, Manipulation, and Distribution—that describes how smart money moves markets.
ICT (Michael J. Huddleston) developed this concept to explain the footprint institutional traders leave behind. The idea is simple: large players need liquidity. They create it by trapping retail traders before making their real move.
The three phases work like this:
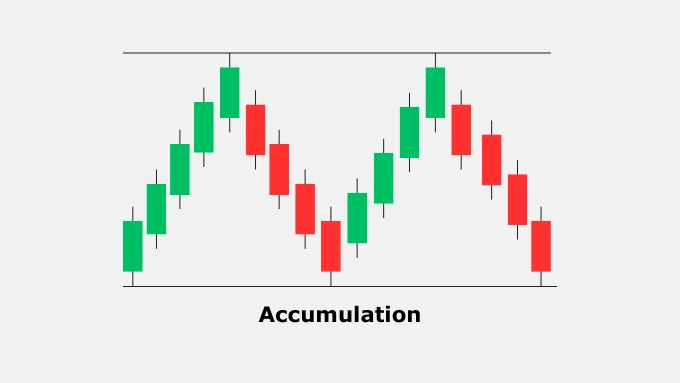
- Accumulation: Smart money quietly builds a position. The price looks quiet, ranging.
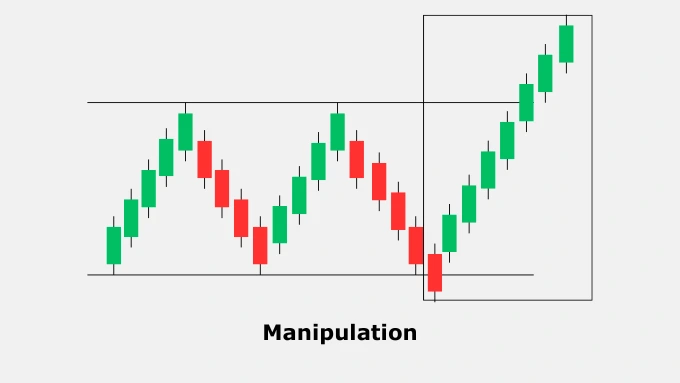
- Manipulation: A false move triggers retail stop losses. This creates the liquidity institutions need.
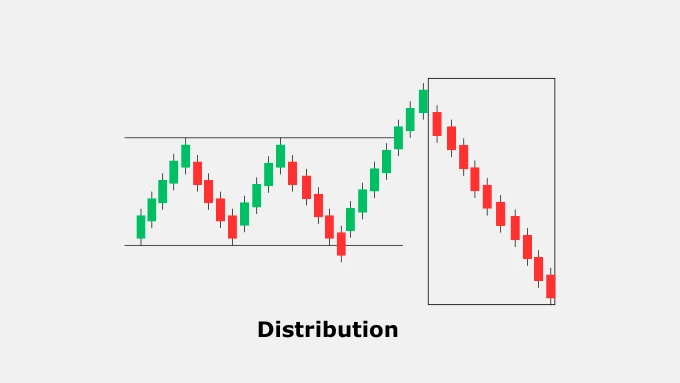
- Distribution: The real move happens. Price delivers hard in the true direction.
Phase 1: Accumulation: The Setup
Accumulation is where smart money loads up before retail traders even know what’s happening.
During this phase, price consolidates. It looks boring. Most retail traders sit on their hands or start trading range highs and lows exactly the wrong move.
What to look for:
- A tight consolidation zone (usually during the Asian session)
- Low volume or compressed candles
- Price respecting a clear range for multiple hours
The Asian session is the most reliable accumulation window for forex pairs. It sets the “dealing range” that the London and New York sessions will exploit.
Think of accumulation like a rubber band being stretched back. The tighter it coils, the harder it snaps.
Phase 2: Manipulation: The Trap
Manipulation is the phase most traders get hurt by it’s a deliberate false move designed to steal retail liquidity.
This is the “stop hunt.” Price breaks above or below the accumulation range, triggering stop losses from traders positioned on the wrong side. Those stops = orders in the market = fuel for institutions.
Key signals of manipulation:
- A sudden spike above a high or below a low (especially at session opens)
- A wick that sweeps a previous day’s high/low, then reverses fast
- Price moving against the higher-timeframe bias before snapping back
The London open (2:00–5:00 AM EST) is where manipulation happens most often. Watch for a false break of the Asian range in the opposite direction of the expected daily move.
This phase is short. It doesn’t last. The moment you see a fast reversal after a stop sweep, you’re potentially watching manipulation complete.
Phase 3: Distribution: The Real Move
Distribution is where the market delivers in the true direction and where disciplined traders make their money.
After the manipulation sweep, smart money has filled its positions. Now price moves often aggressively toward the daily or weekly draw on liquidity.
How to trade distribution:
- Identify the higher-timeframe bias (bullish or bearish for the day)
- Wait for accumulation during the Asian session
- Watch for the manipulation sweep at the London open
- Enter after the reversal confirms the real direction
- Target the opposing session’s liquidity (buy-side or sell-side)
Entry tactics:
- Look for a Fair Value Gap (FVG) or Order Block left behind after the sweep
- Confirm with a market structure shift on the 5-minute or 15-minute chart
- Place your stop beyond the manipulation wick
This is where patience pays. Distribution can run 50–150 pips on major forex pairs on a clean day.
Types of AMD (Accumulation, Manipulation, Distribution):
Bullish AMD:
Bearish AMD:
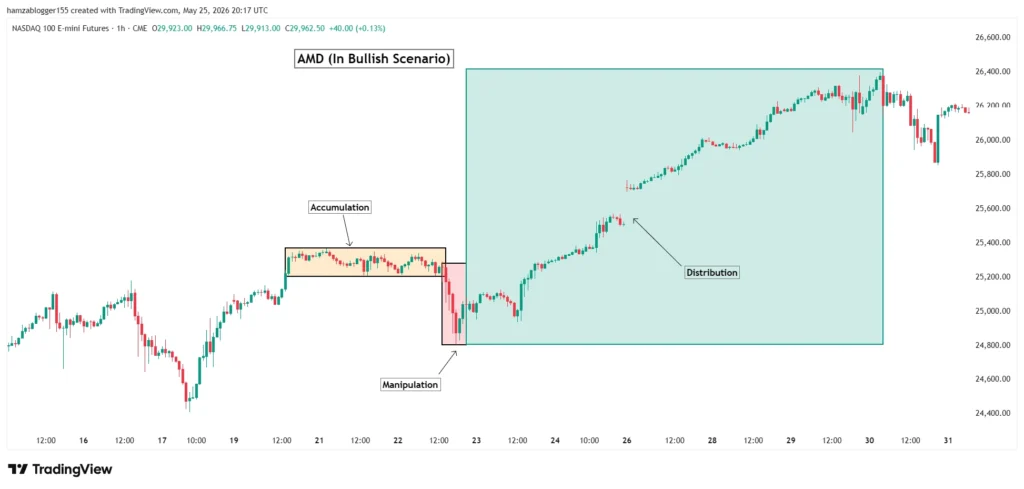
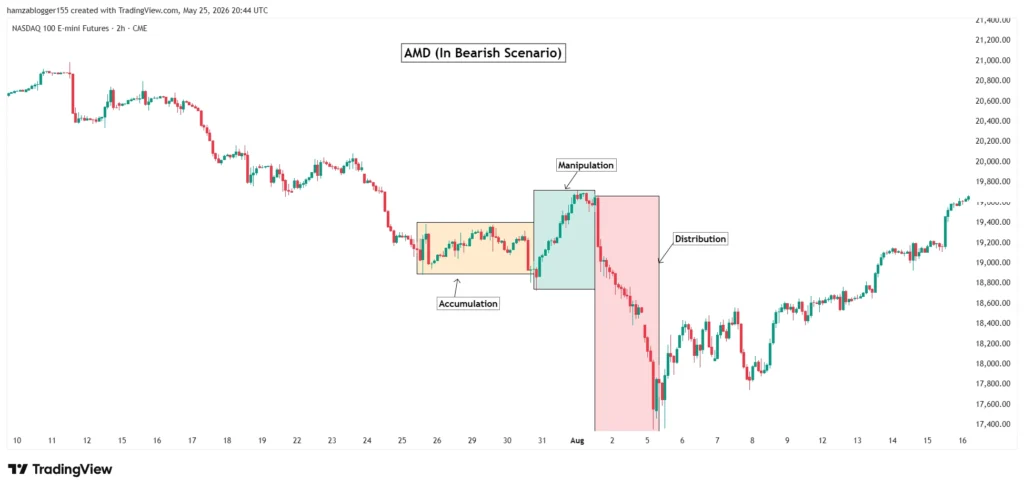
Live Examples of AMD:
Bullish:
Bearish:
Step-by-Step AMD Trade Setup: Full Trade Flow
Understanding the three phases is one thing. Executing a live trade through them is another. Here is the complete AMD trade flow — from pre-market prep to trade exit.
Pre-Session Prep (Before Markets Open)
Before you open a chart, you need context. Without it, you are reacting instead of planning.
- Step 1 — Establish your higher-timeframe bias. Open the daily and 4H chart. Is price trading above or below the previous day’s midpoint? Are you inside a bullish or bearish dealing range? This is your directional bias for the session — bullish or bearish. Do not fight it.
- Step 2 — Mark your liquidity levels. Draw horizontal lines at the previous day high (PDH), previous day low (PDL), and the weekly high and low. These are the pools where stop orders cluster exactly where smart money will hunt during manipulation.
- Step 3—Identify open Fair Value Gaps (FVGs). Check the 1H and 4H chart for any unmitigated imbalances left from recent sessions. These act as magnets during distribution — price is drawn to fill them.
- Step 4 — Check the economic calendar. High-impact events like NFP, CPI, or FOMC can accelerate or completely invalidate AMD setups. Know what’s scheduled before the session starts.
Phase 1 — Accumulation: Mark the Range (Asian Session: 8:00 PM – 2:00 AM EST)
Your only job during the Asian session is to observe. Do not trade.
- Open the 15-minute chart and watch price consolidate into a defined range.
- Mark the Asian session high and Asian session low with horizontal lines. This is your dealing range — the boundaries smart money will exploit.
- A clean accumulation range is typically 10–30 pips on major forex pairs (EUR/USD, GBP/USD). If the range is wider than 50 pips, the setup is likely too messy to trade.
- Note which side of the range the price is leaning toward. If it’s pushing near the highs, the sweep is more likely to take out buy-side liquidity first (bearish AMD). If it’s hugging the lows, sell-side liquidity is the target (bullish AMD).
Phase 2 — Manipulation: Wait for the Trap (London Open: 2:00 AM – 5:00 AM EST)
This is the most critical phase to get right. Most traders lose money here because they react instead of waiting.
- Watch the Asian range boundaries at the London open. Within the first 30–60 minutes, the price will typically make a move either above the Asian high or below the Asian low.
- Do NOT enter on the initial breakout. The breakout is the manipulation. Retail traders see it as a signal to buy or sell. That is exactly the trap.
- Watch for the sweep candle. A strong wick forms beyond the Asian high or low, and then price aggressively closes back inside the range. This is the stop hunt completion.
- Confirm with a Market Structure Shift (MSS). Drop to the 5-minute chart. After the sweep, wait for the price to break a clear swing high (bullish setup) or swing low (bearish setup). That structural break confirms manipulation is done and distribution is starting.
Bullish manipulation signal: Price drops below the Asian session low, sweeps sell-side liquidity, then closes back above the Asian low with a strong bullish candle. On the 5M chart, price then breaks a recent swing high — MSS confirmed.
Bearish manipulation signal: Price rallies above the Asian session high, sweeps buy-side liquidity, then closes back below the Asian high with a strong bearish candle. On the 5M chart, price then breaks a recent swing low MSS confirmed.
Phase 3 — Distribution: Execute the Trade (London/NY Overlap: 7:00 AM – 12:00 PM EST)
The real move begins. Here is your exact entry sequence.
Bullish AMD Entry:
- After the sell-side sweep and the 5M MSS to the upside, identify the bullish displacement candle that caused the break. It likely left a Fair Value Gap (FVG), a 3-candle imbalance where the middle candle has no overlap with the first or third.
- Wait for price to retrace back into the FVG. This is not guaranteed; sometimes price runs without retracing. If it doesn’t pull back, there is no entry. Move on.
- Enter long at the 50% level of the FVG (the consequent encroachment, or CE). This is the midpoint of the gap, the highest-probability entry zone within the imbalance.
- Stop loss: 3–5 pips below the manipulation wick low (the sweep low). If the price returns to invalidate that low, the setup is wrong.
- Target: The next buy-side liquidity level, the previous day’s high, a weekly high, or an unmitigated 4H FVG above the current price.
Bearish AMD Entry:
- After the buy-side sweep and the 5M MSS to the downside, identify the bearish displacement candle and its FVG — the 3-candle gap left as price moved sharply lower.
- Wait for price to retrace up into the bearish FVG. This is institutions re-offering the imbalance before continuing lower.
- Enter short at the 50% CE level of the bearish FVG.
- Stop loss: 3–5 pips above the manipulation wick high (the sweep high).
- Target: The next sell-side liquidity pool—previous day low, a weekly low, or a significant 4H demand zone not yet mitigated.
Phase 4 — Trade Management: Protect and Let It Run
- Take a partial (50%) at a 1:1 risk-reward ratio. Once the price moves the same distance as your stop, close half the position. This locks in real profit and eliminates emotional pressure.
- Move the stop to break even immediately after the partial. You now have a free trade running.
- Let the remainder run to your full target. Do not cut early. Distribution moves are often larger than they look. Trust the structure if your HTF bias were correct.
- Close fully before the end of the NY session (or before a scheduled high-impact news event). AMD is an intraday framework; overnight holds introduce risk the setup doesn’t account for.
AMD Trade Flow at a Glance
| Phase | Session (EST) | Your Action | Key Signal to Watch |
|---|---|---|---|
| Pre-Prep | Before 8 PM | Mark bias, PDH/PDL, open FVGs, check news | HTF direction + key liquidity levels |
| Accumulation | 8 PM – 2 AM | Mark Asian highs and lows. Do not trade. | Tight range, compressed candles |
| Manipulation | 2 AM – 5 AM | Watch for the sweep. Do not follow it. Wait for reversal + MSS. | Wick beyond Asian range + 5M structure break |
| Distribution | 7 AM – 12 PM | Enter at FVG CE level after retracement | FVG retracement + price holds above/below MSS |
| Management | NY Session | Partial at 1:1, breakeven stop, target liquidity | Price reaches opposing liquidity pool |
⚠️ No setup = no trade. If the Asian range is too wide, manipulation doesn’t produce a clean sweep, or your HTF bias is unclear — sit on your hands. Patience is the strategy.
How the ICT Power of Three Works Across Timeframes
The Power of Three pattern repeats across every timeframe—daily, weekly, monthly, and intraday.
This is what makes it so powerful. PO3 isn’t just a 1-hour concept. It nests inside itself:
| Timeframe | Accumulation | Manipulation | Distribution |
|---|---|---|---|
| Monthly | First week | Mid-month sweep | End-of-month move |
| Weekly | Monday | Tuesday–Wednesday | Thursday–Friday |
| Daily | Asian session | London open | NY session |
Wednesday is the most important manipulation day of the week. ICT calls it “Judas Swing” day. If you’re a swing trader, watching Tuesday–Wednesday price action gives you the weekly manipulation signal.
Common Mistakes I See Traders Make With the ICT Power of Three
Most PO₃ failures come from misreading which phase you’re in—or jumping the gun before manipulation confirms.
Here are the top errors:
1. Entering During Accumulation
Traders see the consolidation and try to scalp the range. Don’t. Wait. The range is a trap.
2. Chasing the Manipulation Move
The false spike happens fast. New traders panic and follow it right into the reversal. By the time they’re in, manipulation is over.
3. Ignoring Higher-Timeframe Bias
PO3 setups that go against the daily or weekly trend have a much lower win rate. Always align your trade with the macro direction.
4. Wrong Session Timing
PO3 works best during London and New York opens. Trying to trade it in dead hours produces noisy, unreliable results.
5. No Confirmation Before Entry
Entering the moment price reverses from the sweep isn’t enough. Wait for a market structure shift (MSS) or a confirmed FVG entry on a lower timeframe.
The Trader’s Edge: Your Daily PO3 Checklist
The real edge in PO3 isn’t just knowing the phases—it’s being patient enough to wait for all three to confirm before you act.
Here’s the daily checklist:
- What is the higher-timeframe bias today?
- Where did the price accumulate during Asia?
- Did London Open produce a sweep of that range?
- Did price reverse and shift structure after the sweep?
- Is there a clean FVG or OB for entry?
- Where is the logical target (opposing liquidity)?
If you can’t check all six boxes, there is no trade. That discipline alone puts you ahead of [X%] of retail traders.
Conclusion
The ICT Power of Three is not a magic indicator. It’s a framework that teaches you how the market is structured and why price does what it does.
Here’s what to take away:
- Accumulation = the range. Wait, don’t trade it.
- Manipulation = the trap. Watch it; don’t follow it.
- Distribution = the move. This is your opportunity.
Start by backtesting one pair, one session, for 30 days. Look for the three phases every single day. You’ll start to see the pattern everywhere.
Frequently Asked Questions
What is the ICT Power of Three in simple terms?
The ICT Power of Three (PO3) is a three-phase market model: Accumulation (price ranges quietly), Manipulation (a false breakout traps retail traders), and Distribution (the real directional move begins). It describes how institutional traders engineer liquidity before delivering price.
What timeframe is best for trading the ICT Power of Three?
The 15-minute and 1-hour charts work best for identifying the three phases intraday. Use the 4-hour or daily chart to establish the higher-timeframe bias, then drop to the 5-minute for entry precision during the London or New York session opens.
How do you know if manipulation has occurred?
Manipulation is confirmed when price sweeps a clear high or low (taking out stop losses) and then rapidly reverses with a market structure shift on a lower timeframe. The reversal candle is often sharp and decisive, leaving a wick that breaks the accumulation zone before closing back inside it.
Ready to Go Deeper?
If this guide gave you clarity, you’ll love what we share in our weekly newsletter.
Every week we send:
- A real ICT trade breakdown (annotated chart included)
- One ICT concept explained in plain English
- Common mistakes we’re seeing traders make right now and how to avoid them
No spam. No fluff. Just practical ICT education for traders who are serious about improving.
[Subscribe to our free newsletter to get exciting information related to trading.]
You can unsubscribe anytime. But most subscribers tell us it’s the most useful forex email they get each week.
Risk Disclaimer: This article is for educational purposes only and does not constitute financial advice. Trading forex and other financial instruments involves significant risk. Always use proper risk management and consult a financial professional before making trading decisions.