

Introduction
Most beginner traders lose money not because they lack discipline, but because they follow the wrong map.
They buy when indicators say “overbought.” They chase breakouts. They set stops right where the market always seems to reverse. Sound familiar?
ICT trading flips that map upside down. Instead of following retail trading rules, ICT teaches you to read the market the way banks and institutions actually move prices. It’s one of the fastest-growing forex trading approaches in the world right now, and for good reason.
In this guide, you’ll learn exactly what ICT trading is, how it works, and how to start applying its core concepts as a complete beginner. By the end, you’ll understand market structure, order blocks, liquidity, and how to build your first ICT-based forex trading strategy step by step.
What Is ICT Trading? A Clear, Simple Definition
ICT trading, short for Inner Circle Trader, is a trading methodology created by Michael J. Huddleston. It teaches traders to understand how institutional players (banks, hedge funds, and market makers) move price and then trade alongside them.
The core idea is this: the market doesn’t move randomly. It moves to collect liquidity from the clusters of stop-loss orders left behind by retail traders. Once you learn to spot those clusters, you can anticipate where price is actually heading next.
"Smart money doesn't follow price. It creates it."
ICT trading sits under the broader umbrella of smart money concepts (SMC). Both approaches focus on institutional behavior rather than lagging indicators like RSI or MACD.
The Foundations of ICT Trading: Core Philosophy Explained
The foundation of ICT trading rests on one key truth: retail traders are the liquidity source for institutions.
His central argument: most retail trading education is designed to keep you losing. Indicators, support/resistance zones, and standard chart patterns exist in the market, but institutions know exactly where retail traders set their stops around those levels. And they use that knowledge against them.
How ICT Sees Price Movement
Institutional traders don’t just “buy” or “sell” like retail traders do. They need to fill enormous orders, millions of dollars at a time. To do that, they need liquidity: willing sellers or buyers on the other side of the trade.
So they engineer price to move toward where retail stop-loss orders cluster, triggering them to create the liquidity they need. Then they reverse and move in the direction they actually intended.
In ICT, this is called a stop hunt or a liquidity sweep. Once you see it, you can’t unsee it on your charts.
How ICT Differs From Traditional Technical Analysis
Traditional technical analysis teaches you to:
- Buy at support levels
- Sell at resistance levels
- Use indicators like RSI or Bollinger Bands
- Follow trend lines and chart patterns
ICT flips most of this. Support and resistance zones are actually liquidity pools targets for smart money to sweep. Trend lines are traps. Breakouts often fake out before reversing.
ICT-based price action trading focuses on raw price behavior, time of day, and market structure not lagging signals.
Key ICT Trading Concepts Every Beginner Must Know
This is the core of ICT the vocabulary and tools you’ll use every day. Don’t rush through this section. Each concept builds on the last.
Market Structure: The Big Picture First
Market structure is the backbone of every ICT trade setup. It simply means identifying the direction the price is moving on a given time frame.
- Uptrend (bullish structure): Price makes higher highs (HH) and higher lows (HL).

- Downtrend (bearish structure): Price makes lower lows (LL) and lower highs (LH)

Before taking any trade, ICT traders always identify structure on a higher time frame (weekly or daily chart) first. This establishes what’s called your directional bias, the direction you’re looking to trade for the session.
Why this matters: Trading against the higher time frame structure is one of the most common beginner mistakes. If the daily chart is bearish, your intraday trade ideas should also be bearish.
Order Blocks: Where Institutions Leave Footprints
An order block is the last candle before a strong, impulsive move in price. It represents the area where an institution entered a large buy or sell order before driving price away.
Think of it like a fingerprint left at the scene.
- Bullish order block: The last bearish candle before a sharp move up.

Bearish order block: The last bullish candle before a sharp move down.

When price retraces back into that zone later, it often reacts strongly because institutions are defending their original position or re-entering at the same level.
Why this matters: Order blocks give you a precise entry zone instead of a vague “support area.” This is what separates ICT from generic price action trading.
Fair Value Gaps (FVG): Spotting Price Imbalance
A fair value gap (FVG) happens when price moves so fast in one direction that it skips over a range of prices, leaving a visible gap between three consecutive candles.
Here’s how to spot one:
- Look at three candles in a row
- If the high of the first candle and the low of the third candle don’t overlap that gap. It is an FVG
- Price has a tendency to return to “fill” that gap before continuing
FVGs act as magnets for price. They’re one of the most reliable short-term targets in ICT analysis. We can enter when the price is testing the FVG.
Bullish Fair Value Gap

Bearish Fair Value Gap

Liquidity Pools and Stop Hunts
Every time retail traders place stop-loss orders, they create a pool of liquidity. Institutions need that liquidity to fill their own large orders.
Common liquidity pools appear at:
- Equal highs or equal lows (obvious levels retail traders protect)
- Above swing highs
- Below swing lows
- Liquidity also present below and above trend lines
A stop hunt is when price briefly spikes through one of these levels, triggering all the retail stops before reversing sharply in the other direction.
Once you start labeling liquidity pools on your charts, you’ll notice this pattern constantly. It’s not manipulation in the illegal sense; it’s simply how large orders get filled in a market.
>> If you want to learn more about Liquidity. Checkout my blog on Liquidity Trading Strategy <<
Premium and Discount Zones
ICT uses a simple Fibonacci framework to define two zones within any price range:
- Premium zone: The upper 50% of a price range (expensive, good for sells)

- Discount zone: The lower 50% of a price range (cheap, good for buys)

The idea: institutions buy at a discount and sell at a premium. As a retail trader, you want to align with that behavior.
Draw the range between a significant swing high and swing low. The 50% level (the “equilibrium”) divides premium from discount. Look for buy setups below equilibrium in bullish markets, and sell setups above it in bearish ones.
Killzones: Timing Your Trades Like a Professional
ICT killzones are specific windows of time when institutional activity peaks and price moves most predictably. There are three main ones for forex traders:
| Kill zone | EST Time (Eastern Standard Time) | Why It Matters |
|---|---|---|
| ICT London Kill Zone | 2:00 AM – 5:00 AM | Biggest liquidity session; sets the daily direction |
| ICT New York Kill Zone | 7:00 AM – 10:00 AM | Most volatile; major reversals happen here |
| ICT Asian Kill Zone | 7:00 PM – 10:00 PM | Consolidation sets up liquidity for London |
| ICT London Close Kill Zone | 10:00 AM – 12:00 PM | Overlapped with new york session |
Most ICT traders only look for setups during these windows. Trading at random times outside the kill zones dramatically reduces the reliability of any setup.
>> If you want to learn more about ICT Kill Zones. Read the blog post from inner circle trader on ICT Kill zones.<<
Advanced ICT Concepts: Going Deeper Into Price Delivery
Once you’re comfortable with the basics, these advanced concepts sharpen your precision significantly.
Optimal Trade Entry (OTE) Using Fibonacci
The Optimal Trade Entry (OTE) is a specific Fibonacci retracement zone ICT traders look for after a strong impulsive move.
Here’s how to apply it:
- Identify a swing low and swing high (or vice versa)
- Draw a Fibonacci retracement between those two points
- The OTE zone sits between the 0.62 and 0.79 retracement levels
- Wait for price to pull back into this zone before entering
Why does it work? Institutions often wait for the price to pull back before adding to their positions. The OTE zone captures that re-entry sweet spot.

Power of Three (PO3): The Daily Market Blueprint
Every trading day, ICT teaches that price follows a three-phase cycle:
- Accumulation: Price consolidates in a tight range (usually during the Asian session)
- Manipulation: Price sweeps liquidity in one direction (the false move)
- Distribution: Price reverses and runs in the true intended direction
Understanding PO3 helps you avoid getting caught in the fake move (manipulation phase) and position yourself for the real move (distribution phase) instead.

Breaker Blocks vs. Mitigation Blocks
These are two ICT concepts that beginners often confuse.
- Mitigation block: A mitigation block is an order block that temporarily reverses the price but fails to continue the current trend by creating a new higher high or low.
Bullish Mitigation Block:

Bearish Mitigation Block:

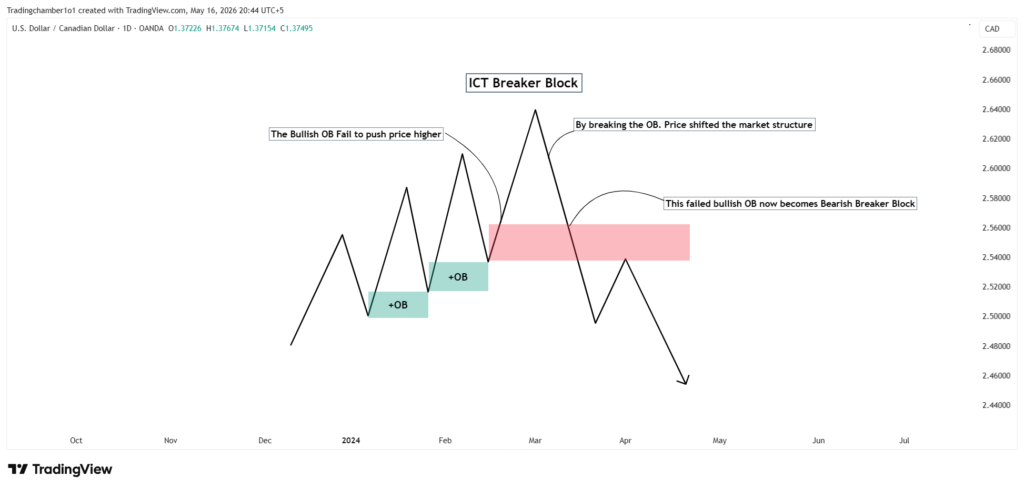
- Breaker block: A Breaker Block is a failed orderblock. A failed order block that results in a significant shift in market liquidity.
Breaker blocks are particularly powerful because they represent a change of character in price a failed level that flips its role entirely.
Bullish Breaker Block:

Bearish Breaker Block:
Higher Time Frame Bias and Top-Down Analysis
Top-down analysis is how ICT traders avoid trading against the trend. The process works like this:
- Monthly chart → Identify the macro direction (bullish or bearish)
- Weekly chart → Identify key levels and market structure
- Daily chart → Define your session bias and draw order blocks
- 4H / 1H chart → Look for entry opportunities aligned with higher time frames
- 15M / 5M chart → Fine-tune your entry within the killzone
This drill-down approach means every trade you take has multiple time frames confirming the same direction. That alignment is what gives ICT setups their edge.
How to Build an ICT Trading Strategy : Step by Step
Now let’s bring everything together into a repeatable process you can follow on any trading day.
Step 1: Identify the Higher Time Frame Bias
Open your weekly and daily charts before the week begins. Ask: Is the market making higher highs and higher lows (bullish) or lower lows and lower highs (bearish)?
Mark the most recent significant swing high and swing low on the daily chart. This is your working range for the week.
Step 2: Mark Out Key Liquidity Levels and Order Blocks
On your daily and 4H chart, identify:
- Equal highs or equal lows (liquidity pools)
- The last order block before the most recent impulsive move
- Any open fair value gaps from the last 48–72 hours
These become your key areas of interest for the week.
Step 3: Wait for the price to Enter a kill zone.
Do not look for trades outside the London or New York killzone windows. Open your chart at 2:00 AM EST (London) or 7:00 AM EST (New York) and watch for the price to begin moving.
Patience here is everything. ICT trading rewards waiting, not watching.
Step 4: Look for a Market Structure Shift on Lower Time Frames
Once price enters a kill zone and approaches one of your marked levels, drop to the 5-minute or 15-minute chart. Watch for a market structure shift (MSS), a candle that breaks and closes above a previous swing high (for buys) or below a previous swing low (for sells).
This shift signals that the short-term direction has changed and aligns with your higher time frame bias. It’s your trigger to look for an entry.
Step 5: Entry, Stop Loss, and Take Profit the ICT Way
Once you see the MSS:
- Entry: Enter at the nearest order block or FVG on the lower time frame
- Stop loss: Place your stop below the liquidity sweep low (for buys) or above the liquidity sweep high (for sells) just past the point smart money swept
- Take profit: Target the next liquidity pool above (for buys) or below (for sells)
Aim for a minimum 2:1 risk-to-reward ratio. Many ICT setups offer 3:1 or better.
The Trader Edge: Common ICT Mistakes I See.
This section covers the errors that hold most beginners back and cost them real money.
Mistake #1: Trading without a higher time frame bias
Beginners jump to the 5-minute chart and trade every setup they see. Without a clear daily or weekly directional bias, you’re trading noise, not structure. I saw traders in repeatedly burn accounts by ignoring the daily chart entirely.
Mistake #2: Treating every order block as valid
Not all order blocks are equal. A stale order block that price has already visited multiple times has little power left. Fresh, untouched order blocks, especially those aligned with higher time frame structure, are what you want.
Mistake #3: Trading outside the zones
The ICT concepts work because they exploit institutional behavior during peak liquidity windows. Trading a London killzone setup at 1:00 PM EST is like fishing in an empty pond. Time your analysis to match when the big players are actually active.
Mistake #4: Ignoring the Asian session consolidation
Many beginners skip the Asian session entirely. That’s a mistake. The Asian range sets the liquidity levels that London sweeps. Marking Asian highs and lows every day takes five minutes and gives you your two primary targets for the day.
Mistake #5: Over-leveraging entries at order blocks
Order blocks don’t guarantee bounces; they increase probability. Always risk only 1–2% of your account per trade, regardless of how confident you feel.
Risk Management in ICT Trading: Protecting Your Capital First
A perfect ICT setup means nothing if poor risk management blows your account.
Why Risk Management Is the Backbone of Every ICT Setup
ICT trading offers precision entries, but that precision doesn’t mean you’re right 100% of the time. Even the best traders have losing streaks. Your job is to survive them.
The goal is simple: keep losses small enough that your wins more than cover them.
How to Calculate Position Sizing
Use this formula before every trade:
Position size = (Account balance × Risk %) ÷ Stop loss in pips × Pip value
Example: $10,000 account, 1% risk, 15-pip stop on EUR/USD:
- Risk amount: $100
- Pip value (standard lot): $10
- Position size: $100 ÷ (15 × $10) = 0.67 mini lots
>> If you want to find position size for your trades. Click on the link Position Size Calculator Tool. You can calculate your position size easily with our tool. <<
The 1–2% Risk Rule
Risk no more than 1–2% of your trading account on any single ICT setup. This means that even if you hit 10 losses in a row (unlikely but possible), you still have 80–90% of your capital intact.
Beginners who risk 5–10% per trade blow their accounts before they ever develop skill. Give yourself time and runway to learn.
Building a Trading Journal
A trading journal is your most underrated tool. After every trade, log:
- Date, time, pair, and killzone
- Your bias (daily/weekly structure)
- Setup type (order block, FVG, PO3)
- Entry, SL, and TP levels
- Outcome and what you learned
After months of journaling, patterns emerge: which setups work best for you, which killzone you trade most accurately, and where your discipline breaks down. This self-knowledge is priceless.
Best Tools, Platforms, and Resources to Learn ICT Trading
You don’t need expensive software to get started with ICT concepts.
Charting Platforms
- TradingView: The most popular choice for ICT traders. Free tier works for beginners; paid plans unlock multi-chart layouts and more indicators. Most ICT community members share public charts here.
- MetaTrader 4 / MetaTrader 5 (MT4/MT5): Standard platforms for forex brokers. Less intuitive than TradingView for drawing ICT concepts, but widely supported.
Free ICT Learning Resources
- Michael Huddleston’s YouTube channel hundreds of hours of free content straight from the source
- ICT mentorship content (2016–2022 archives) widely shared in trading communities
- r/Forex and r/Daytrading subreddits: real discussions and chart reviews
Paid vs. Free Content
The honest answer: most of what you need to learn ICT is free. The paid courses and communities mainly offer structure, accountability, and access to a community of traders at similar stages. If you’re self-disciplined, free content is more than enough to start.
Practice on a Demo Account First
Before trading a single real dollar with ICT concepts, spend at least one month trading on a demo account. Use the same position sizing, the same killzones, and the same journaling habits you’d use with real money. Treat it seriously or the demo phase teaches you nothing.
ICT Trading Pros and Cons Is It Right for You?
ICT trading isn’t for everyone. Here’s an honest breakdown.
| Pros | Cons |
|---|---|
| Precision: ICT gives you specific entry zones (order blocks, FVGs) instead of vague areas | Steep learning curve: There’s a lot of vocabulary and concept-layering to absorb |
| Institutional alignment: You’re trading with smart money, not against it | Subjectivity: Two ICT traders can look at the same chart and identify different order blocks that’s why context matters. |
| Versatility: The concepts work across forex, indices, crypto, and commodities | Time-zone dependent: The killzones are fixed in EST; traders in Asia or Europe need to adjust their schedules |
| Free to learn: The foundational material is widely available at no cost | Over-complication risk: Beginners often layer too many ICT concepts at once, creating analysis paralysis |
| No indicators required: ICT is pure price action no lagging signals to second-guess | Information Overload: Beginners will find it difficult to stick with a single strategy. |
ICT Trading vs. Smart Money Concepts (SMC)
You’ll often hear ICT and SMC used interchangeably. The distinction:
- ICT refers specifically to Michael Huddleston’s original methodology and terminology
- SMC is a broader educational movement that adapted ICT concepts, often simplifying or rebranding them
The core principles are the same. Most SMC educators built their content on ICT foundations. If you learn one, you understand the other.
Is ICT Trading Right for You?
| You’re a good fit for ICT trading if you: | ICT might not be the right fit if you: |
|---|---|
| Are patient and willing to wait for high-probability setups | Want quick results with minimal screen time |
| Can trade during London or New York killzone hours | Prefer mechanical, rule-based systems with no subjectivity |
| Enjoy studying charts and understanding market logic | Struggle with patience and impulse trading |
| Are willing to journal and review your trades consistently | |
| Can handle periods of doing nothing and waiting for the right setup |
Conclusion: Your Next Step as an ICT Trader
Here's what you've learned in this guide:
ICT trading is based on understanding how institutional players create and consume liquidity
Core concepts include market structure, order blocks, fair value gaps, liquidity pools, and killzones
A repeatable ICT strategy follows a top-down process: high time frame bias → key levels → killzone entry → lower time frame confirmation
Risk management specifically the 1–2% rule and consistent journaling is what makes the strategy sustainable long-term
ICT works, but it rewards patience, study, and discipline over shortcuts
The biggest mistake new ICT traders make is trying to trade everything at once. Pick one concept market structure, for example and master it before layering in others. Build your skills sequentially, not all at once.
Your 30-day action plan:
- Week 1: Study market structure only. Label every chart in terms of HH/HL or LH/LL. Nothing else.
- Week 2: Add order blocks. Find and mark them on historical charts before looking for live setups.
- Week 3: Introduce killzones. Only open your charts during London and New York sessions.
- Week 4: Paper trade your first full ICT setups using the 5-step strategy from this guide. Journal every trade.
After 30 days, review your journal. Where did you follow the process? Where did you break it? That review is where real improvement happens.
Ready to Go Deeper?
If this guide gave you clarity, you’ll love what we share in our weekly newsletter.
Every week we send:
- A real ICT trade breakdown (annotated chart included)
- One ICT concept explained in plain English
- Common mistakes we’re seeing traders make right now and how to avoid them
No spam. No fluff. Just practical ICT education for traders who are serious about improving.
👉 [Subscribe to our free newsletter to get exciting information related to trading]
You can unsubscribe anytime. But most subscribers tell us it’s the most useful forex email they get each week.
Risk Disclaimer: This article is for educational purposes only and does not constitute financial advice. Trading forex and other financial instruments involves significant risk. Always use proper risk management and consult a financial professional before making trading decisions.