Fibonacci levels are extremely powerful and useful when used in combination with other technical analysis. It enhances our analysis and trade decision making process. The tool can calculate Fibonacci levels on both bullish and bearish case scenarios.
What are Fibonacci Levels?
Fibonacci levels and patterns are found in nature . They are a very popular method to evaluate the price movement of an asset in the financial markets. And as with any indicators that are popular, its significance is dependent on its self-fulfilling prophecy. For example: Fibonacci 61.8% is considered as a Golden Ratio.
Many professional traders use this level as a confluence factor for there trades. Fibonacci golden ratio is used as an extra level of confirmation in their technical analysis.
Fibonacci levels are classified into two categories: extensions and retracements. Retracement levels are correction levels applied to the price of an asset following an increase in price, which occurs in an upward trend, or a new low on a downtrend, or when traders recognize the temporary conclusion of a trend. If the market starts consolidating it will experience market corrections or pullbacks that are referred to as Fibonacci Retracement levels.
Key Fibonacci Retracement Levels 0.236, 0.382, 0.500, 0.618, 0.764
On the other side, Fibonacci extension levels are applied to the price of an asset to show an indication of the continuance of trend. Market prices may (not necessarily) adjust to any of the Fibonacci retracements levels and then continue to move to the direction of the primary trend, establishing new lows or highs. It could also carry along in the direction of the primary trend following an initial consolidation period, but without touching any Fibonacci Retracement levels.
Key Fibonacci Extension Levels 0.382, 0.618, 1.000, 1.382, 1.618
Fibonacci levels are not some magical numbers, so there is no magic or universal law in each of the Fibonacci ratios. These are just potential level where the price might reverse and show some kind of opportunity.
The traders have been using the Fibonacci golden ratio 61.8% as a potential entry level. If you want more in depth knowledge of Fibonacci retracement level checkout out Investopedia blog on Fibonacci retracement levels.
How to Use the Fibonacci Levels Calculator
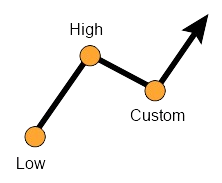
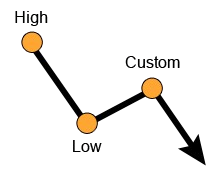
The direction of the trend The traders in this area can mimic an uptrend as well as downtrend by selecting “Up” or “Down”. Let’s say, for instance that we want to determine the Fibonacci Retracements for the EUR/USD pair, which is currently on an upward trend in the chart for weekly, to determine a suitable entry point.
First, for our example, we choose the “Up” trend direction. Then, we click the “Retracement” radio button, to instruct the calculator to calculate the levels of retracement.
Low price: In this field traders should enter the EUR/USD exchange rate at its lowest price, which is printed at the beginning of the upward trend such as 1.16653.
High price: In this field traders should enter the EUR/USD pair’s highest price that was attained within the current upward trend, such as 1.20552.
Then, we press the “Calculate” button.
The result: The Fibonacci Levels Calculator will calculate and display the five Retracement levels for the EUR/USD currency pair. The retracement levels were generated by combining the two extremes (lowest or highest swing or simply points A and B) of an asset’s price movement and divide horizontal distances by important Fibonacci ratios of 23.6 percent, 38.2%, 50 percent, 61.8% and 78.6 percent.
In our case the uptrend, the lowest variation of the EUR/USD (point A) was 1.16653. The price action climbed to the highest level of 1.20552 (point B). After entering the information into our calculator, we discovered that the Fibo Retracement ranges include 1.1987 to represent the 23.6 percent retracement, 1.1944 for the 38.2 percent retracement, 1.191 for the 50.0 percent retracement and so on.
The calculator will display levels of retracement by default. To display the projection (extension) levels traders must fill out the “End price” field (required) and the calculator will show up to six possible levels of projection (maximum 261.8 percent between 2.618 Fibo and 261.8%). 2.618 Fibo).TIPIn the field of financial trading, the three most frequently used Fibonacci levels of retracement are 23.6 percent (0.236), 38.2% (0.382) and 50 percent (0.500). For extensions, the three most frequently used Fibonacci extensions in the financial market are 61.8 percent (0.618) 100 percent (1.000) and 161.8 percent (1.618).
Checkout our extremely useful forex tools for beginner traders. These tools will help them in your trading. Visit our website trade guide to get the latest information about financial markets.